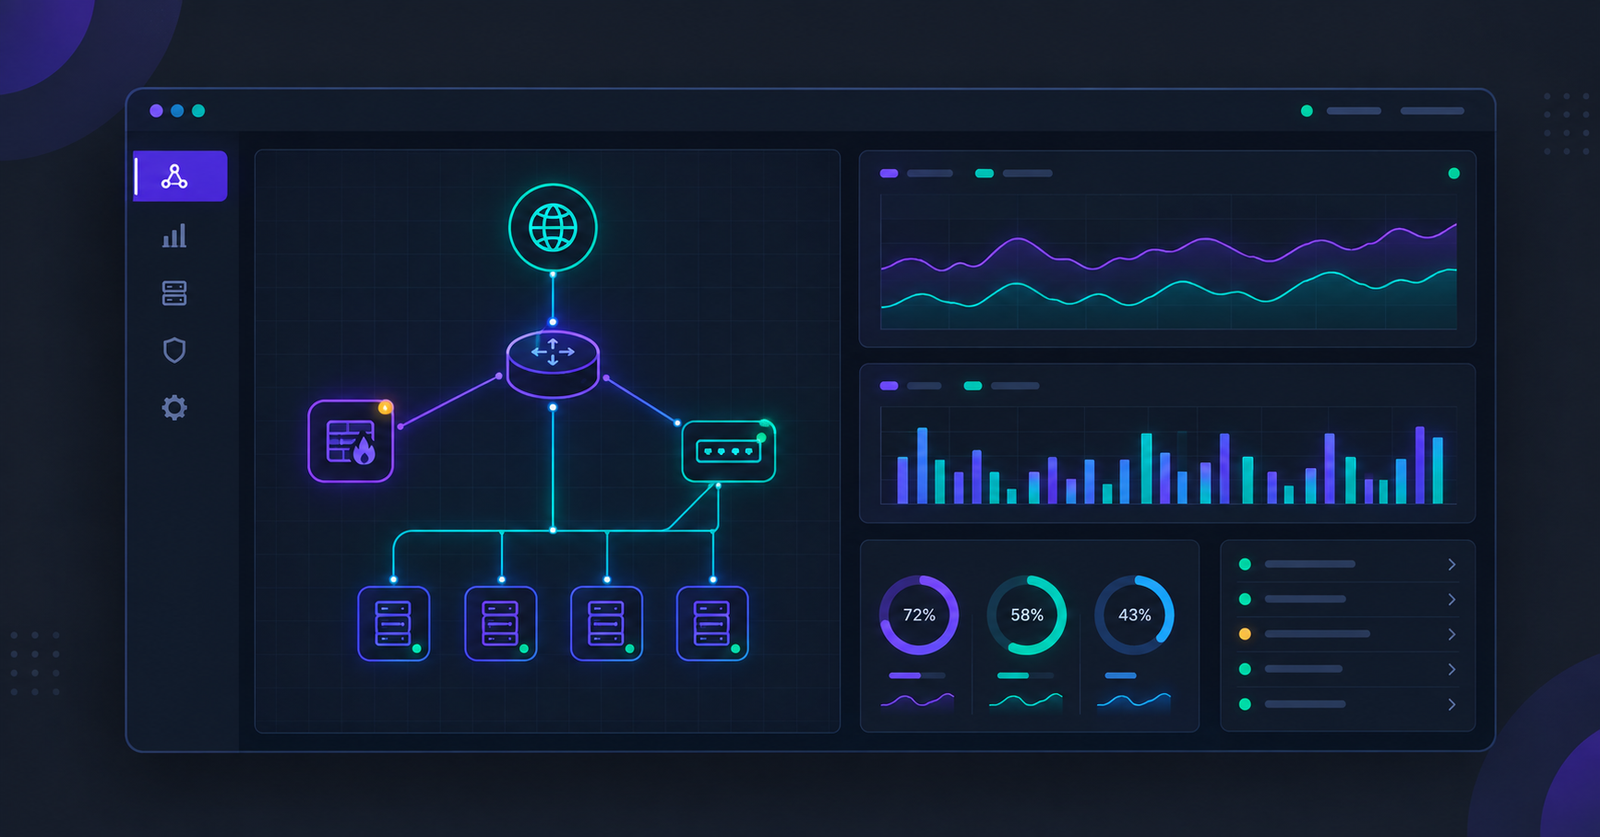
Network monitoring means continuously watching the health of routers, switches, firewalls, servers, and VMs so problems get caught before they cause an outage. Most tools work by periodically pinging system ports and tracking response times, uptime, and thresholds over time.
When comparing tools, a few things matter most: network mapping, SNMP support, how granular the monitoring interval is, uptime and downtime tracking, threshold-based alerting, bandwidth monitoring, and how usable the dashboard actually is. Here’s a rundown of the tools worth evaluating.
SolarWinds Network Performance Monitor
One of the most widely used options, built to quickly detect, diagnose, and resolve performance problems. Its web-based dashboards are customizable, and it supports intelligent, dependency-aware alerting across a full network topology.
PRTG Network Monitor (Paessler)
An agentless tool that’s approachable for teams without deep monitoring experience. PRTG covers infrastructure via SNMP, WMI, SSH, packet sniffing, HTTP requests, REST APIs, ping, and SQL.
ManageEngine OpManager
An enterprise-grade option that continuously monitors every IP-connected device on the network and gives deep visibility and control over the whole infrastructure.
Nagios XI
Scales from freelancers to large enterprises with flexible licensing (free, open-source, one-time, or subscription). Notable features include a strong monitoring engine, capacity planning, configuration wizards, and advanced user management.
WhatsUp Gold
Focused on speed of problem detection, with features like world-map traffic views, cloud application monitoring, granular active-state reporting, and configuration-discrepancy detection.
Zabbix
A fully open-source, enterprise-capable tool with an easy-to-configure web GUI and trend forecasting based on historical data. It’s strong for networks under roughly 1,000 nodes; performance can degrade past that, and it lacks built-in real-time testing.
Icinga
Built by former Nagios developers, Icinga is flexible and easy to use for both SMB and enterprise networks, with solid threshold analysis and alerting via email, SMS, or mobile apps.
Datadog
Purpose-built for hybrid cloud environments, monitoring network, application, and service performance together. It’s quick to deploy via platform-specific agents (Windows, macOS, various Linux distros, Docker, Chef, Puppet) and offers extensive API access for custom graphs and dynamic alerts.
ConnectWise Automate
A cloud-based monitoring and management platform (formerly Labtech) that auto-discovers network devices and can trigger automated remediation actions. Its centralized patch management is a standout feature.
LogicMonitor
A SaaS monitoring platform that auto-discovers infrastructure and layers on predictive alerting and trend analysis. It supports over 1,000 technologies and is known for a highly customizable dashboard.
OP5 Monitor
An enterprise monitoring solution built on the open-source Nagios project, covering servers, networks, applications, and storage across on-premise, hybrid, or cloud environments. Highlights include unified dashboards, strong scalability, automation, SNMP trap handling, and SLA reporting.
Whichever tool you choose, it’s only as good as the infrastructure it’s watching. A stable dedicated server or VPS gives your monitoring stack accurate, low-noise data to work with.